What Are the 17 Ad Metrics You Must Track to Stop Wasting Your Budget
The foundational element of any marketing strategy driven by performance is ad metrics. If your business is currently investing in paid user acquisition through an app, you may be feeling overwhelmed by all of the information that can be found on the ad metrics dashboard. There is a confusion of metrics that change day to day, monthly reports that do not match one another, and all levels of stakeholders who expect you to provide them with easy-to-understand answers.
The biggest problem is not collecting the data; it is figuring out what ad metrics represent actual growth and what represents “noise.” This challenge is widespread: nearly 47% of marketers currently struggle to measure ROI across multiple channels, leaving them unsure which signals are driving value. When you optimize the wrong data signal, your ad spend will be depleted without the ability to scale, putting you at risk for your next successful ad campaign.
This guide will outline the 17 most relevant ad metrics you should be measuring, how each of these metrics is related to the others, and how you can use them to make better, more informed decisions about growth with Apptrove.
Why Ad Metrics Determine Whether You Grow or Plateau
Constant pressure exists within your role as an app marketer; you need to bring users in at lower costs while increasing both retention and revenue. Surface-level metrics like installs and clicks tend to be tracked and reported most often because they are easy, so it’s natural to be drawn towards these numbers.
The issue is that many times your ad metrics will be fragmented between various ad networks, attribution tools, and internal analytics. Therefore, you are only seeing part of the overall story – one dashboard may be telling you that campaign performance looks great, while another may indicate inefficiencies. This disconnect will create indecisiveness and a tendency towards reactive decision-making.
When you can align your ad metrics with real business outcomes, such as lifetime value and retention, then you move away from chasing vanity metrics and into a mindset of building sustainable growth.
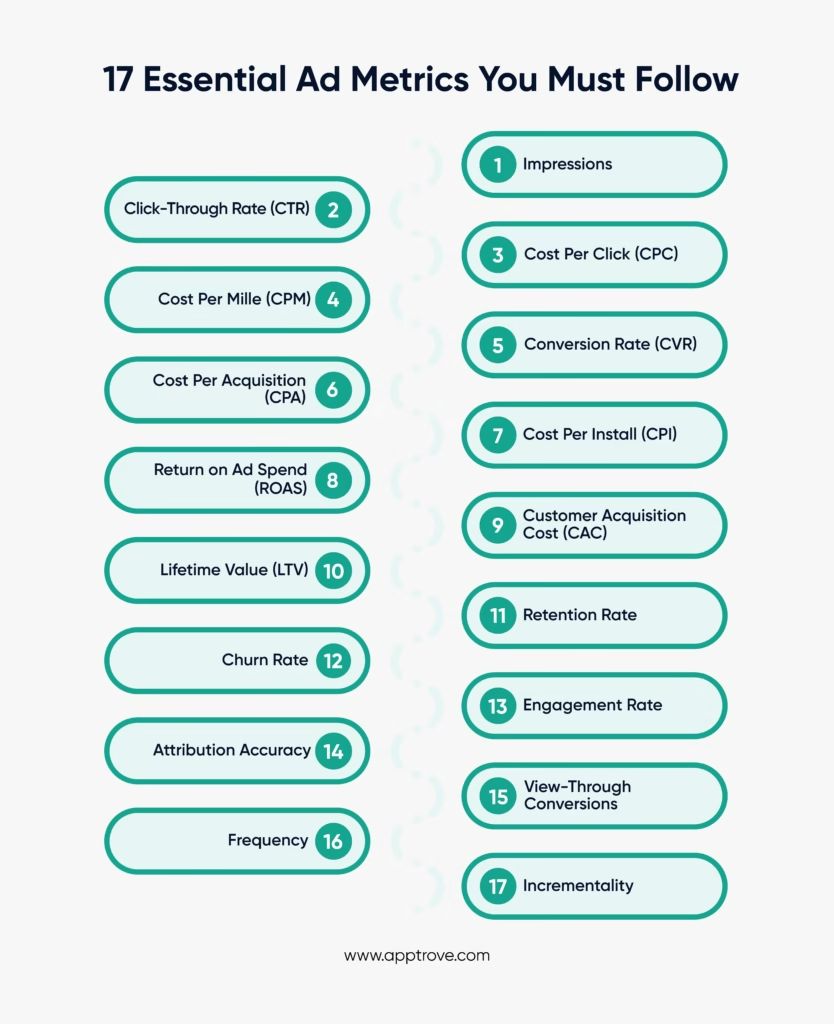
1. Impressions
Impressions show how many times your advertisement has been shown to users. Although they don’t internally communicate any type of engagement, they do tell how visible your campaign is across specific audiences or platforms (i.e., who/where someone sees it). Impressions can tell you whether the top of your funnel is working as intended and if your reach strategy is providing you with the proper audience. Additionally, you can analyze downstream metric trends (i.e., applications, subscriptions, etc.). It may be due to poor creativity, or perhaps that the users you are targeting are not utilizing what you are advertising.
2. Click-Through Rate (CTR)
CTR indicates the percentage of individuals who clicked your advertisement after viewing it and represents the ad’s level of interest as it relates to their intended purchase. Additionally, CTR allows you to assess the relevancy and effectiveness of your ad copy, imagery and overall campaign.
A declining CTR may signify either an absence of interest or relevancy of the ad (saturation) in the target audience. In addition to tracking CTR, it is essential to examine post-click engagement metrics to ensure that each engagement creates a desirable return on your investment.
3. Cost Per Click (CPC)
CPC quantifies the actual cost incurred each time a user clicks on your ad, thereby measuring the competition for the auction of the ad space and, therefore, how efficiently the ad is run on the platform.
While lower CPC may seem attractive, a low statistic does not specifically correlate to a high return; the value of CPC may only be measured effectively when considered in conjunction with conversion rates and profitability as measured by revenue-generating metrics.
4. Cost Per Mille (CPM)
CPM refers to the cost of 1,000 impressions. It provides a view into how expensive it is to gain visibility within your target audience.
If CPM rises significantly without improvement in CTR or conversion rate, it may indicate declining ad relevance or increased competition. Monitoring CPM allows you to adjust bidding strategies proactively.
5. Conversion Rate (CVR)
Conversion rate shows the percentage of users who complete a desired action after clicking your ad. For mobile apps, this could mean installs, registrations, or purchases.
A strong CTR combined with a weak conversion rate often indicates friction in your landing page or app store listing. Conversion rate connects engagement with action, making it a critical layer within your ad metrics framework.
6. Cost Per Acquisition (CPA)
CPA measures the cost of acquiring a user who completes a defined action. Unlike CPC, it directly ties spend to outcomes.
However, CPA must be analyzed in context. A low CPA can be misleading if the acquired users do not generate long-term value. That is why it should always be compared with lifetime value and retention.
7. Cost Per Install (CPI)
CPI is one of the most commonly tracked ad metrics in mobile marketing. It measures the cost of driving an app install.
While reducing CPI may seem like the ultimate goal, focusing only on installs can lead to attracting low-intent users. CPI becomes meaningful only when linked to in-app engagement and revenue data.
8. Return on Ad Spend (ROAS)
ROAS calculates the revenue generated for every unit of currency spent on advertising. It is one of the most important indicators for scaling campaigns.
Short-term ROAS metrics, such as Day 1 or Day 7, can sometimes create a distorted view of profitability. Evaluating long-term ROAS ensures that your ad metrics reflect sustainable growth rather than temporary spikes.
9. Customer Acquisition Cost (CAC)
CAC represents the total cost of acquiring a customer, including marketing and operational expenses. It provides a broader perspective compared to CPA.
When CAC consistently exceeds lifetime value, your growth model becomes unstable. Monitoring CAC alongside other ad metrics helps you maintain financial balance while scaling.
10. Lifetime Value (LTV)
LTV estimates the total revenue a user generates over their relationship with your app. It determines how much you can afford to spend on acquisition.
If you understand LTV clearly, you can bid more aggressively and compete confidently in auctions. LTV transforms ad metrics from short-term performance indicators into long-term growth predictors.
11. Retention Rate
Retention rate measures how many users return to your app after installation. It highlights whether you are acquiring users who genuinely find value in your product.
High acquisition numbers with poor retention indicate a mismatch between targeting and product experience. Retention is one of the most critical ad metrics for evaluating user quality.
12. Churn Rate
Churn rate reflects the percentage of users who stop engaging with your app over a given period. It reveals how quickly users drop off after acquisition.
If churn is high, the issue may lie in onboarding, targeting, or overall user experience. Analyzing churn alongside acquisition metrics helps you identify where growth leaks occur.
13. Engagement Rate
Engagement rate tracks user actions inside your app, such as session frequency or event completion. It bridges the gap between acquisition and monetization.
Without monitoring in-app engagement, your ad metrics remain incomplete. Engagement shows whether users are interacting meaningfully with your product after installation.
14. Attribution Accuracy
The accuracy of attribution indicates if conversions are accurately attributed to where they originated. Incorrect attribution will cause the rest of the advertising metrics to lose their dependability.
If conversion attribution is inaccurate, it can lead to double-counted conversions and/or overstated credit for some networks. Mobile unified measurement solutions will help to link campaign and in-app metrics to deliver reliable insights.
15. View-Through Conversions
View-through conversions are users who see an ad but later convert without clicking on it. This metric will allow assessment of the indirect effects of campaigns.
By not including view-through conversions in your analysis, you may be underestimating upper-funnel activity. Including view-through conversions “completes the picture” of campaign performance.
16. Frequency
Frequency refers to how many times users have been exposed to your advertising message. Frequent exposure can enhance recall, but over-exposure can cause advertising fatigue.
If CTR drops concurrently with an increase in frequency, you may want to refresh your creative or reach out to a different target group. Monitoring frequency will assist in preserving both advertising performance and user experience.
17. Incrementality
Incrementality analysis evaluates whether conversions resulted from your advertising activity or if they would have occurred naturally. Incrementality allows you to understand the actual impact of advertising as compared to random occurrences.
By understanding incrementality, you will avoid overspending on users who would have converted without your ads. Incrementality is one of the more critical advanced advertising KPI’s in avoiding budget misallocation.
The Hidden Problem: Fragmented Data
One of the most frustrating problems you may run into is a lack of consistency in reporting platforms. Different networks may have their own performance information versus the numbers that are shown in the analytics tools, and the reports out from the revenue dashboard will show different numbers altogether.
These inconsistencies create confusion in the decision-making process. Rather than scaling up with confidence, you hesitate because you cannot trust your data enough to make confident business decisions. Thus, one of the main reasons you see a need for unified measurement frameworks for modern app marketers.
Tools like Apptrove focus on connecting acquisition data with post-install event data, retention data, and revenue data. Once your ad metrics align with how the user journey flows, you are able to optimise your apps intentionally instead of reacting after the fact to what you think is working/not working.
Turning Ad Metrics into Growth Strategy
To utilize ad metrics properly, you must arrange them in three phases of growth. Stage one is dedicated to awareness and acquisition efficiency. Stage two assesses performance and cost-effectiveness. Finally, stage three gauges long-term value and sustainability. Once you analyze metrics in this tiered structure, patterns will be easier to comprehend; thus, top-of-funnel engagement will impact retention, and the quality of your user base will reflect on your revenue. The use of this structured methodology allows you to turn your data into a usable strategy.
Conclusion
The ad metrics you use are much more than points of reference to share during your weekly meetings; they’re how you will decide how to grow your business. If you only look at clicks and installs, you could end up massively scaling campaigns that appear to be great looking, but don’t create lasting value for your business.
When you build a unified reporting framework combining acquisition, engagement, retention, and revenue, you can remove the guessing game from the equation. You will know what acquisition channels create users that will pay for your product, and what acquisition channels result in a negative ROI.
Seeing the entire journey that users take from ad impression to lifetime value gives your company the ability to create long-term, sustainable growth through strategic scaling of your business.
FAQs
1. What are ad metrics in digital advertising?
Advertising metrics measure how well your advertising is performing by providing you with measurable metrics such as CTR (Click through rate), CPA (Cost per acquisition), ROAS (Return on advertising spend), Retention rate, and LTV (Lifetime Value), that track whether or not your marketing investment is yielding tangible business results.
2. Which ad metrics matter most for mobile apps?
The most critical advertising metrics for mobile applications, CPI (Cost per Install), CPA, ROAS, Retention Rate, and Lifetime Value of a user, tie the cost of acquiring users to the quality of those users and their future revenue potential over time to promote growth sustainably instead of just increasing longevity through greater downloads.
3. How do ad metrics reduce wasted ad spend?
Advertising metrics determine which channels, creative concepts, or types of audiences are generating poor results and which ones are resulting in valuable users. This analysis will allow you to determine how to reallocate your advertising budget towards higher-impact advertising initiatives, and thereby reduce the amount you are wasting on ineffective advertising.
4. Why is attribution important when analyzing ad metrics?
If there is a lack of accurate attribution, your advertising metrics will tell you that the wrong source caused your conversions. Accurate attribution allows you to measure the effectiveness of your campaigns more effectively for decision-making and future scaling purposes.
5. How often should ad metrics be reviewed?
You should monitor the most significant advertising metrics of CTR, CPC, and CPA daily throughout your campaign’s duration and long-term metrics of retention, lifetime value of a user, and incremental revenue generation weekly or monthly as the basis for developing long-term marketing tactics.
from Apptrove https://apptrove.com/what-are-the-17-ad-metrics-you-must-track/
via Apptrove


Comments
Post a Comment